Customer
A large industrial research organization. Research focuses primarily on IT hardware, software, and services.
Challenge
Verify uniform force distribution and quality of electrical connectivity on a pressurized Land Grid Array (LGA) interposer. Automate a time-consuming and physically prohibitive process involving substantial measurement, data recording, and data presentation effort.
Solution
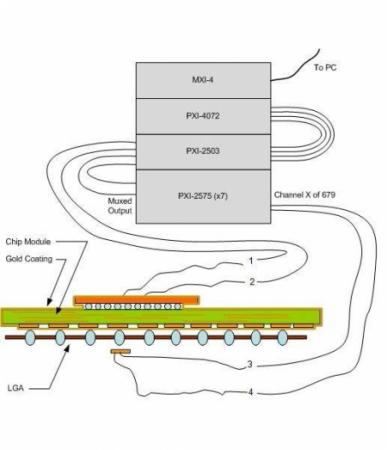
Bloomy developed a LabVIEW and PXI-based measurement system that automatically cycles through a set of resistive test points, and takes two- and four-wire resistance measurement. The results are then mapped into an equivalent data structure that recreates the LGA layout, and presents a visually informative 2D and 3D graphical display.
Features
- NI-PXI 1044 Chassis with MXI interface
- 1 PXI-4072 DMM
- 7 PXI-2575 Multiplexers
- 1 PXI-2503 Multiplexer
- Automatic cycling and acquisition of resistance values
- 2-wire and 4-wire resistance measurements
- Data automatically saved to Excel in multiple formats
- Auto-generated 2D and 3D resistance map images, are user adjustable and can be exported to file
- 2D and 3D image views can be saved and restored
- Simple, intuitive user interface
Results
Automated measurement process reduced test time to 10% of the manual test process. LGA resistance mapping of over 600 contacts is performed in only 5 minutes, whereas the previous method required 20 minutes for 400 resistance measurements, limited to a single measurement type, plus an additional 30 minutes to prepare the resistance maps off-line. New improvements include integrated analysis and presentation, combined resistance measurement types, and evaluation over changes in time, pressure, and temperature. PXI has provided the ability for wide-range flexible measurements, while LabVIEW provided the platform for implementing an intuitive, scalable, and vital tool for thorough and rapid testing of LGAs, ranging from experimental designs, prototypes, and production units.