To celebrate the release of the newest EFT Module for TestStand version, which adds native support for LabVIEW and TestStand 2019, we wanted to share with you some very useful features that you might not be aware of.
If you are an existing user of the module, we hope at least one of these helps you with your day-to-day testing needs. If you are not yet a user and these features have piqued your interest, you can learn more about the EFT Module for TestStand on the products page. I recommend that you start with the video on the Overview tab. Both new and existing users can download the latest version (2019_0_24) from the Downloads tab, unzip and install. A 30-day free trial is provided, after which a license purchase and activation is required.
Embedding custom dialogs into the EFT Manufacturing OI
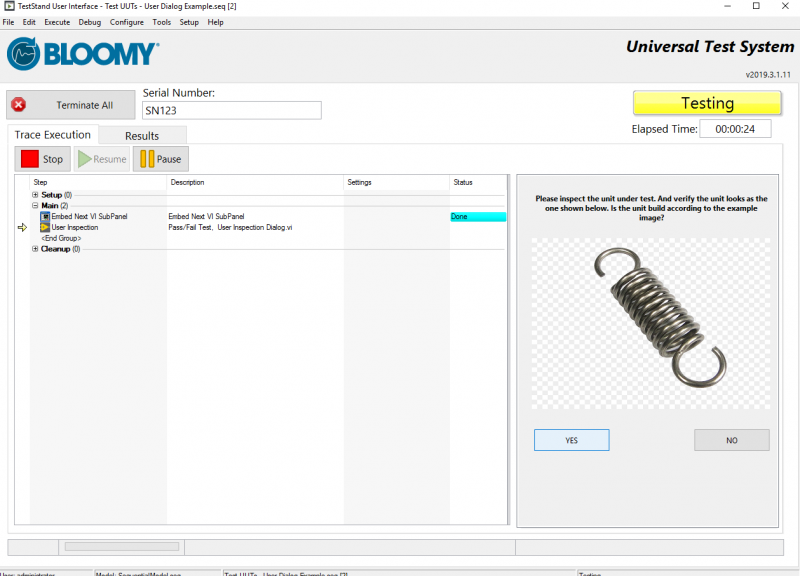
Figure 1 The EFT OI can display embedded, interactive dialogs. With them, you can stop worrying about your dialogs getting lost in the background or minimized.
If you are an existing user of the EFT Module for TestStand, you are probably already taking advantage of the Hardware Access Framework step types from within TestStand’s sequence editor to easily interface with your test station’s hardware. You can find and quickly access these step types from the sequence editor’s Insertion Palette, as seen below.
But have you noticed that the EFT Module also includes a set of custom step types for interacting with the EFT Module’s Manufacturing Operator Interface (OI)? The following shows you how to use the EFT OI Subpanel VI step to effortlessly create interactive dialogs that can be embedded directly into the EFT Module’s Manufacturing OI, providing a more refined user experience, without the annoyance of modal dialogs getting hidden behind the OI.
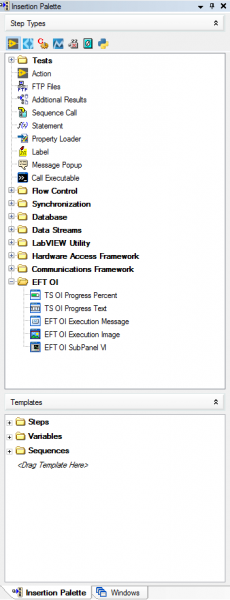
Figure 2 The EFT OI palette contains a collection of useful step types to interact with the EFT Module’s Manufacturing OI directly
First, create a new sequence and insert any type of step that uses the LabVIEW Adapter. For this example, we will be using a Pass/Fail Test step. Optionally, click the Create VI.. button. This will open a new VI window with pre-populated connector pane to interface with the TestStand step we just created. If you would like to use your own VI, feel free to do so! The panel-embedding feature works with pretty much any LabVIEW VI.
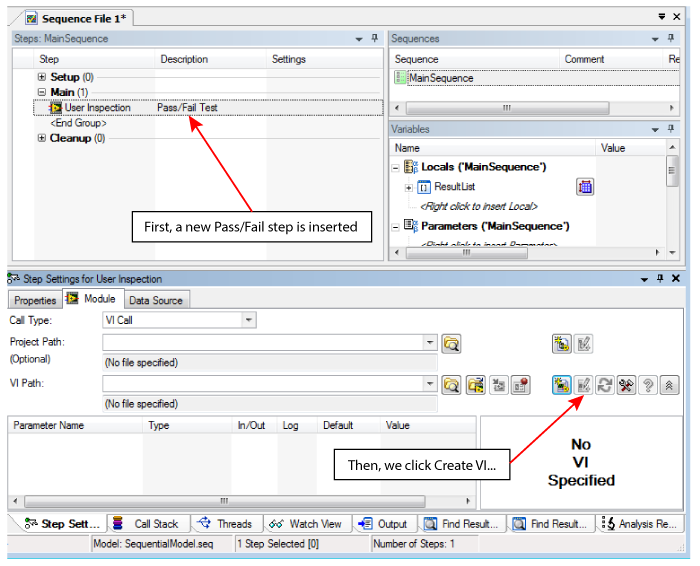
Figure 3 A new step is inserted using TestStand’s Create VI... function, but the front panel of any other VI can be used instead.
For my VI, I created a simple two-button dialog with a picture. Its block diagram is a simple while loop and event structure that triggers when either of the buttons shown below are clicked, the VI stops and returns TRUE if the ‘YES’ button was pressed.
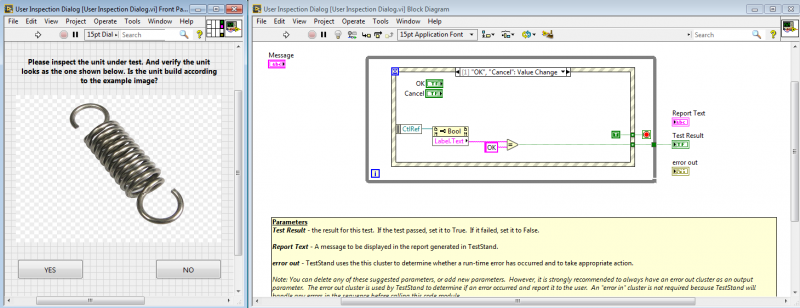
Figure 4 A simple two-button dialog.
Now we need to insert the star of this tip! Expand the EFT OI folder in your Insertion Palette and drag into your sequence the Embed Next VI SubPanel step so that it executes before your LabVIEW step, as shown below.
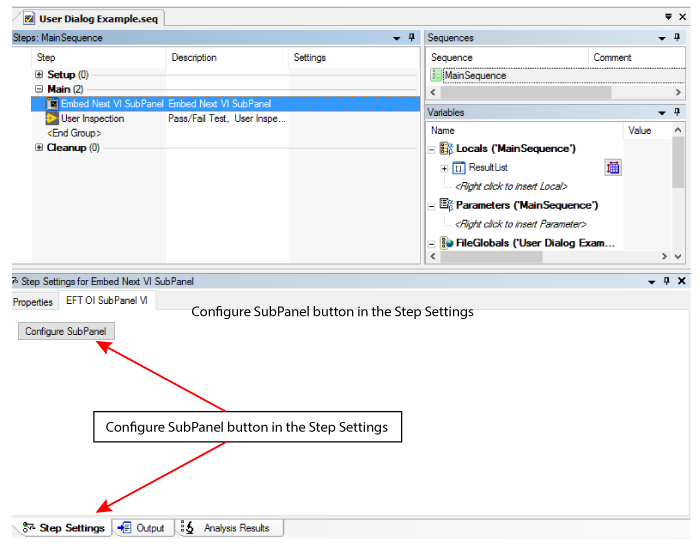
Figure 5 It is important that the Embed Next VI Subpanel step is inserted into the sequence
directly before the step that references the VI with the front panel we want to display.
If we now click the Configure SubPanel button found in the Step Settings panel for Embed Next VI SubPanel, we are shown the dialog below. The EFT Execution SubPanel configuration dialog is telling us there are 2 things we need to fix: our VI’s panel is not configured to be shown, and we are not using the LabVIEW Runtime Engine adapter. We will take care of those in order.
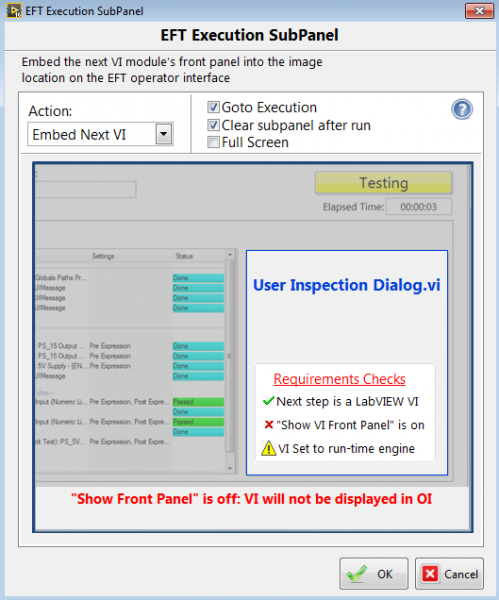
Figure 6 The step's configuration dialog performs a simple check to make sure the next step is configured properly to be displayed in the EFT Manufacturing OI.
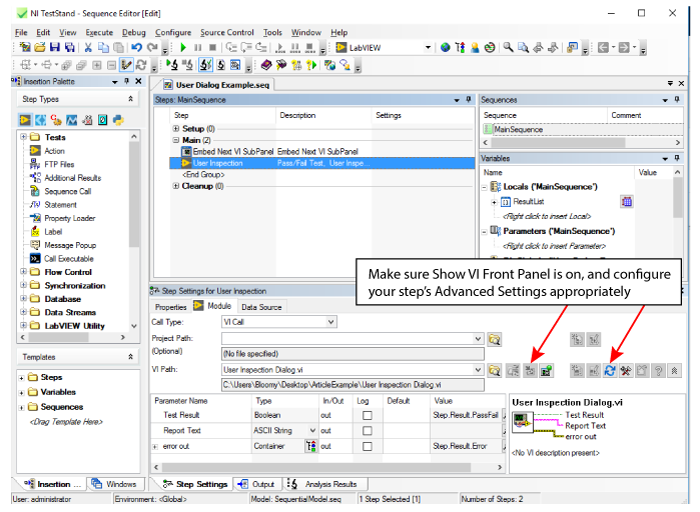
First, to configure our dialog VI so that its panel is shown, we simply need to select it in our sequence and use the Step Settings pane to set the Show VI Front Panel property to ON, as shown below.
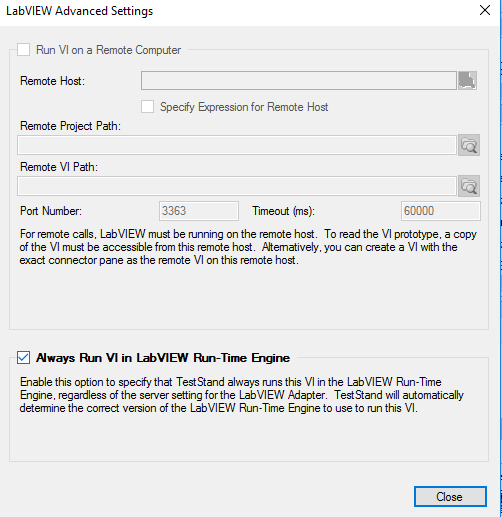
Finally, we need to configure our dialog VI so that it always runs using the Run Time Engine. To do this, we will click the Advanced Settings button in the Step Settings pane. In the dialog that appears, check the option to Always Run VI in LabVIEW Run-time Engine.
And that’s it! When you run your sequence next from the EFT Manufacturing OI, you will be able to interact with the VI you created directly through its interface, without having to worry about the dialog window being hidden in the background or closed by accident.

Figure 7 The dialog is now displayed in the EFT Manufacturing OI's execution panel. You can experiment with
LabVIEW panes and subpanels to allow your VI to dynamically resize with the OI's screen.
Interfacing with hardware using the EFT Module’s HAF Manager
The EFT Module’s HAF Manager allows you to express your system’s configuration in terms of a list of instruments, signals, and connections. You can then use the Hardware Access Framework palette in TestStand to create your sequence using these definitions. This creates a layer of abstraction where your sequence code only knows about your signal, instrument, and connection names, which gives you the freedom to alter the specifics of those elements without having to change your sequence.
However, this is not all that the HAF Manager can do! Did you know you can interact with all your instruments, signals, and connections directly from the HAF Manager? It is quite simple to do, and this tip will show you how.
For this tip, I will be using the TED Test example sequence that ships with the EFT Module for TestStand. You can find this sequence in C:\Users\Public\Documents\UUT Test Files\Tests\TED Example.
This example includes some simulated hardware, which we will install by navigating to ~\Support Files and opening TED CONFIGDATA.nce. If you can’t open this file, you might have to download and install the NI DAQmx driver from NI’s website.
After opening TED CONFIGDATA.nce, we are presented with the dialog shown below. We can click through the options presented using their default values.
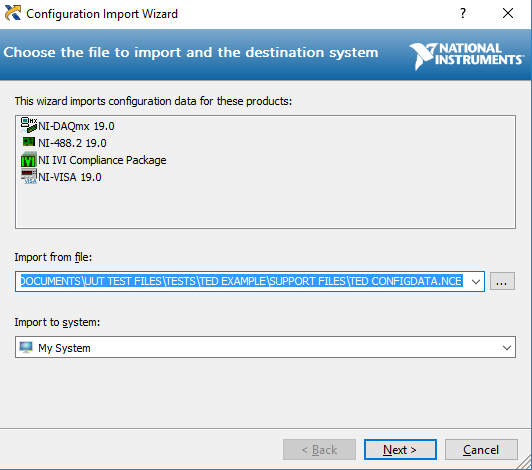
Figure 8 The Configuration Import Wizard will import into our system the simulated instruments needed to run TED Test.seq.
Once the above step is complete, open TED Test Config.haf, also found in the ~\Support Files folder. This will open the EFT Module’s HAF Manager.
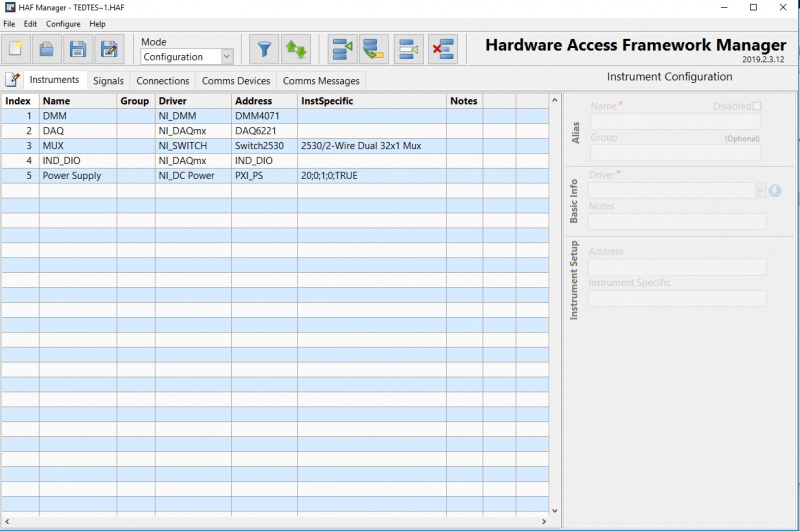
Figure 9 TED Test Config.haf contains the configuration data for the simulated instruments, signals, and connections that TED Test.seq requires to execute.
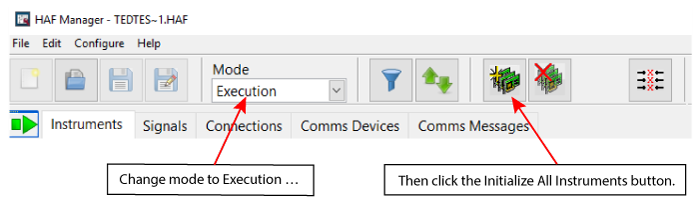
Once here, we will change the HAF Manager’s Mode to Execution. This will change the options available to us in the top panel to match what is shown below. Next, we will click the Initialize All Instruments button.
If all steps were completed successfully, the Initialized state of each of the virtual instruments will change to True.
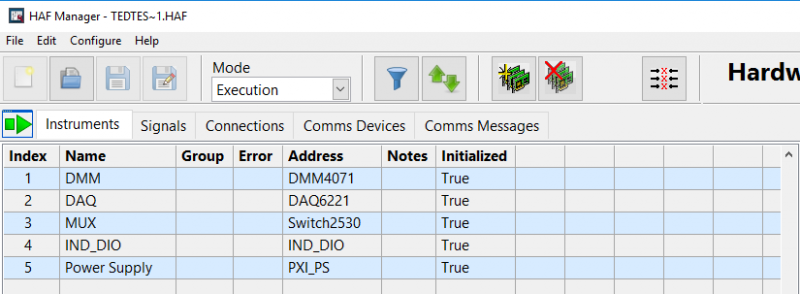
Figure 10 All instruments are initialized and ready to go!
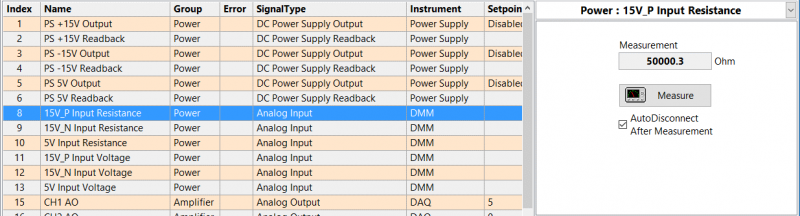
Now, we can switch over to the Signals tab and interact with the simulated instruments directly.
For example, we can take a simple resistance measurement using our simulated DMM if we select the 15V_P Input Resistance signal…
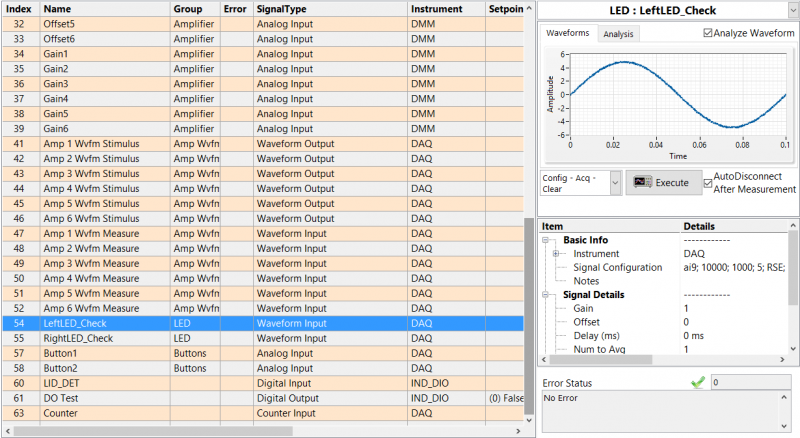
Or even something more complex, like a waveform signal, which we can try out if we scroll down and select LeftLED_Check…
BONUS TIP: Debugging your sequence using the HAF Manager
If you have been following along thus far, you now know how to use the EFT Module’s HAF Manager to interface with your hardware easily, but the HAF Manager has one more trick up its sleeve: you can also use it to debug your hardware AS YOUR SEQUENCE IS RUNNING!
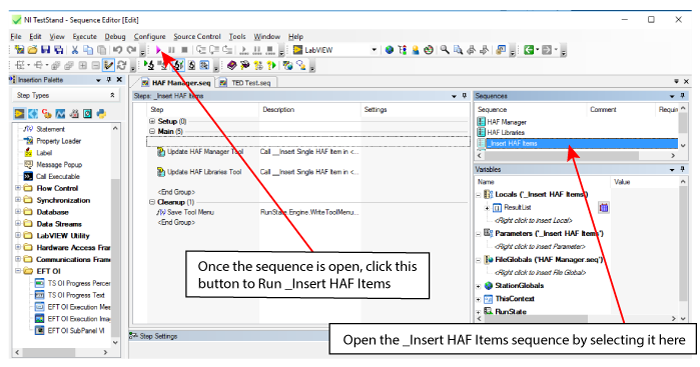
We must do a bit of prep-work beforehand to do this. First, navigate to %teststandpublic%\Components\Tools\HAF Manager (you can copy and paste this address into the navigation bar of your file explorer), and open HAF Manager.seq. Once open, use the Sequences pane in the TestStand Sequence Editor to open the _Insert HAF Items sequence and run it.
You can confirm that the sequence executed successfully by clicking the Tools button in the sequence editor toolbar to confirm that it now includes options for HAF Manager and HAF Libraries, as shown below. You can close HAF Manager.seq afterwards.
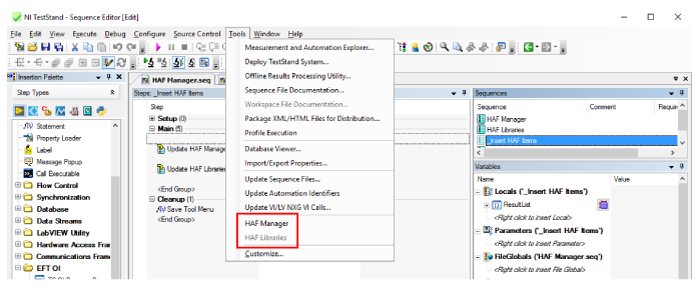
Figure 11 We now have added new options to our Tools menu that allow us to call the HAF Manager and HAF Libraries directly from TestStand's sequence editor.
To demonstrate, we will once again use the TED Test.seq shipping example located in C:\Users\Public\Documents\UUT Test Files\Tests\TED Example. This time, we will open the sequence file using TestStand’s Sequence Editor by double-clicking TED Test.seq.
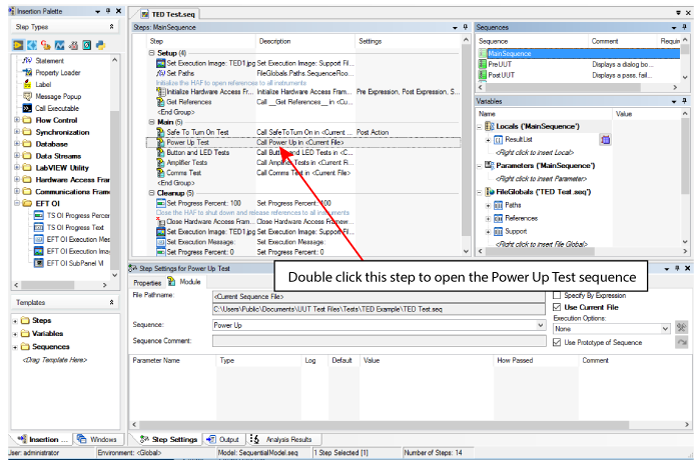
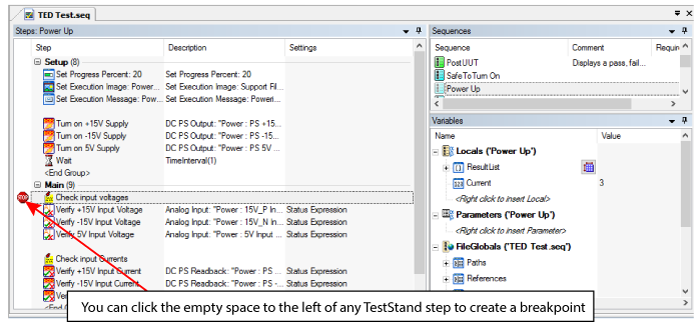
Next, double click the Power Up Test sequence call step to open the Power Up sequence and create a break point by clicking to the left of the Check input voltages label step, as shown below.
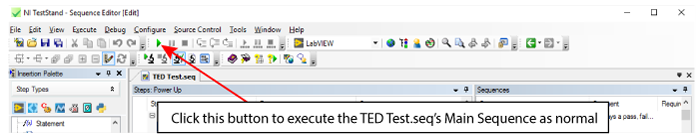
Now that our breakpoint is in place, we can execute the sequence by pressing the F5 key or clicking the Test UUTs button in the Sequence Editor’s toolbar.
The sequence will pause automatically upon reaching the Check input voltages step. Once it does, click the Tools menu and select HAF Manager to launch it. When launched this way, the HAF Manager uses the currently active session data with your instruments, which you can verify by noting that the instrument’s Initialized state is already True when the HAF Manager is launched.
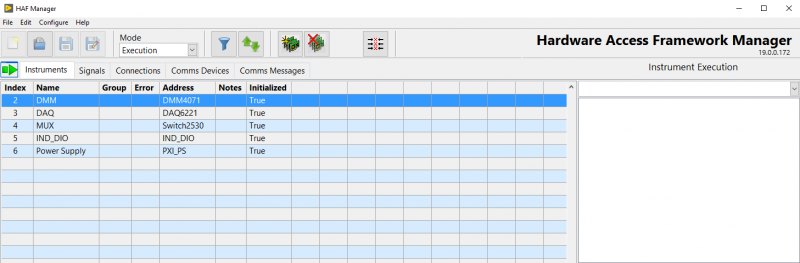
Figure 12 When launched using TestStand's Sequence Editor while a sequence is being executed, the HAF manager will initialize in Execution mode and will use currently active session data with all instruments.
This allows us to interact with our instrumentation as noted in our previous tip, which allows us to exert greater control over how our sequence executes when debugging problems. Below, we use this to change the connected state of one of our connections.
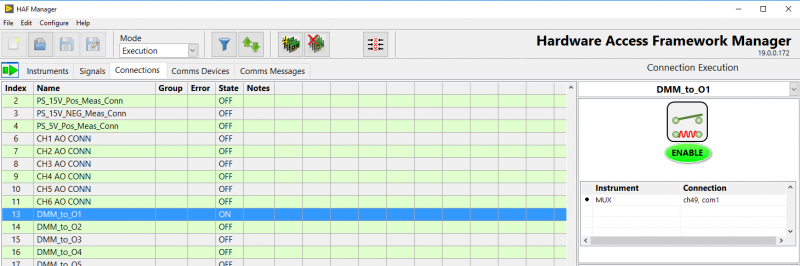
Figure 13 The HAF Manager's Connections tab can be used to change the state of switches, matrix nodes or multiplexers, even during a sequence's execution!
Related Links
- rodrigor's blog
- Log in or register to post comments