Upcoming New Features
EFT version 2.2 is coming soon with loads of new features to further increase productivity and reduce test development time. While there are dozens of new features and improvements to the EFT Module for TestStand, let’s take a look at five of the most exciting updates.
Operator Interface SubPanels
This has been by far our most requested feature. The ability to embed VI subpanels from a TestStand sequence into the EFT Manufacturing OI makes for a seamless, intuitive operator experience. Rather than using modal dialogs to interact with the operator, you can now embed the front panel of most VIs running in TestStand into the operator interface. This is great for tasks like serial number entry, setup confirmation, or displaying waveforms in real time. Embedding subpanels is quick and easy from the TestStand sequence editor. Simply drop in the  step type just before the VI to embed, set the VI to execute in the run-time engine, and ensure the VI’s front panel is set to show when called. You can even configure the VI to either run on the side of the OI execution, or as a full screen – covering the entire trace execution. Want to run these VIs outside of the EFT OI? Not a problem, if the EFT OI is not there to embed the VI, it will automatically be displayed as a dialog box.
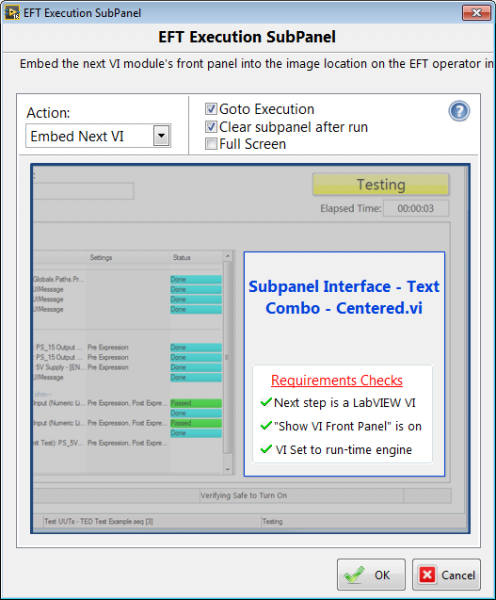
Figure 1: Embed Next VI SubPanel StepType Configuration Dialog
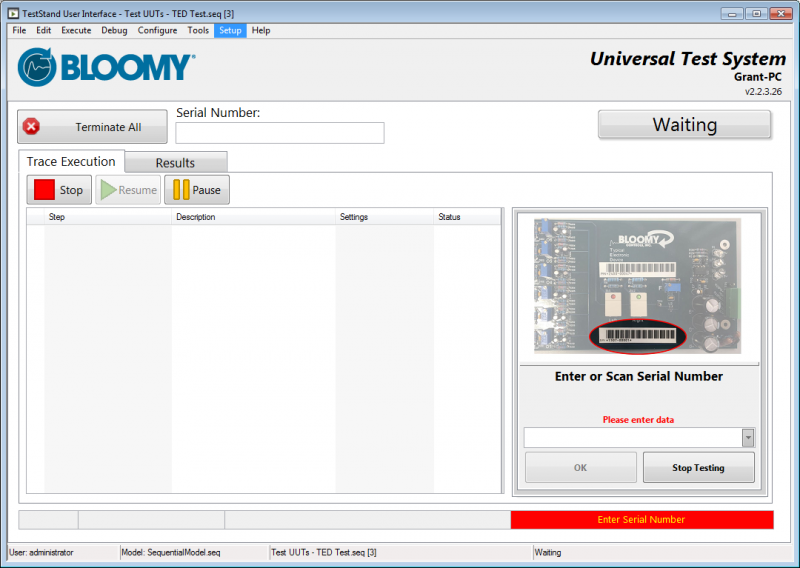
Figure 2: EFT OI SubPanel Screenshot
Need help getting started? The shipping example sequence (My Documents\UUT Test Files\Tests\TED Example) uses sub panels for the serial number entry and pass/fail banner.
Bonus OI Interface Step Types
In addition to the subpanel step type, now all EFT OI Interface functions, like progress percent and text, OI Images, and execution messages, can be defined using new EFT OI Interface StepTypes. Simply drop down the desired OI Interface, click the configure button and quickly set up run-time feedback to your operators. The step types even provide a preview of how they will look in the EFT Manufacturing OI.
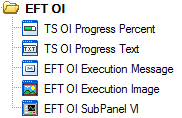
Figure 3: EFT OI Interface Step Types
Linked HAF Configuration Files
When developing configuration files for a test system, the instrumentation rarely changes, and there are often standard signals and connections that are shared across multiple UUTs. That’s why starting with version 2.2 of the EFT Module for TestStand, HAF configuration files can link to other HAF configuration files. The intention for this link is to reduce the duplication of effort associated with creating configuration files for multiple UUTs that run on the same system. This also allows tests to more easily be deployed to multiple test stations (which may have slightly different hardware) without having to change every UUT's configuration file. For advanced users, nested links are possible as well, as each HAF configuration file can link to as many other external HAF files as desired, and those can link to other external HAF files. This can be especially helpful with high channel count tests, like system self-test.
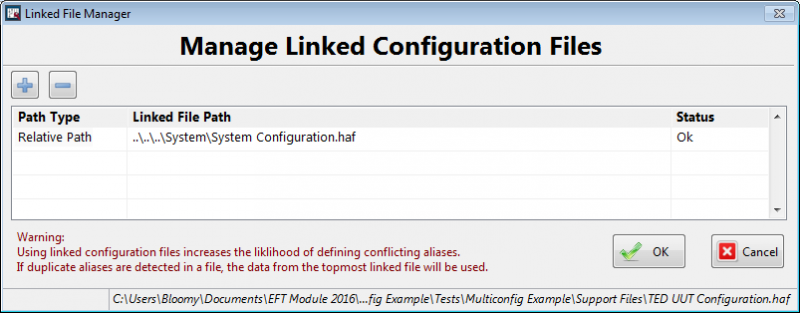
Figure 4: HAF Linked File Manager
The Linked File Manager allows you to specify relative paths to any external HAF configuration files you’d like to link to.
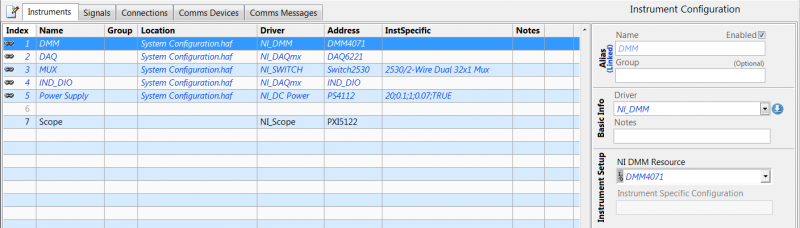
Figure 5: HAF Manager with Linked Instruments
Linked abstractions (Instruments, Signals, Connections, etc) show up in the configuration file in blue italics so you know that they are defined in another file. They can’t be edited here (that defeats the purpose of the link), but you can disable them as needed.
Single UUT DB Report Generation
In addition to the ‘Flat File’ view in the EFT DB Report Generator where each row contains a UUT Test, the EFT DB Report Generator can now generate a Single UUT Report which shows more detail about each test result in a sequence. Getting to the report is easy, just query results using the flat file view, then select the desired test run and choose ‘Single UUT Report.’ Just like the Flat File view, these reports can be exported to an external file. In addition to the old CSV format, you can also now export your reports from any tab to tab delimited text files.
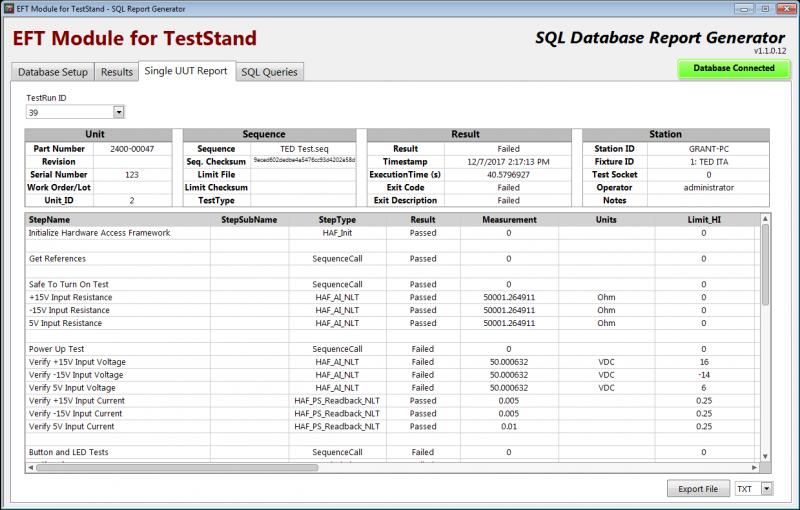
Figure 6: EFT DB Report Generator Showing Single UUT Reports
Powerful HAF Diagnostics
The HAF Manager started out as a tool for defining your HAF configuration files, then we added the ability to manually interact with your HAF-defined instrumentation by providing the ‘Execution Mode’, a soft panel interface for controlling instruments, signals, connections, and communications. We’ve now extended the power of the Execution Mode by allowing you to run it in parallel with your TestStand Sequence. Once your test sequence is running, simply launch the HAF Manager from the TestStand Tools menu to open it up in the current TestStand application instance. You’ll now be able to see the last values for all measurements as your sequence executes. You can even pause the sequence, interact with your hardware using the HAF Manager in the exact state that TestStand left it in, then resume TestStand when you’re done. This gives engineers and technicians much more control of the system during sequence execution, which can drastically reduce debug and diagnostic time.
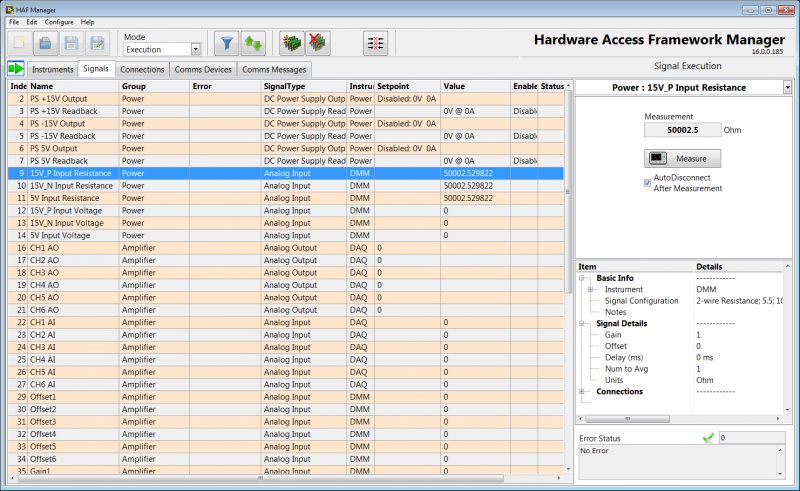
Figure 7: HAF Manager Execution Mode Showing Run-Time Updates to Measurements
In addition to the soft panel, you can now more easily dive into the HAF StepType and plugin driver VIs. From the HAF Manager, choose Help > HAF Libraries, and you’ll see a list of all installed HAF libraries. Double click on any library to open it up in the TestStand application instance, allowing you to set breakpoints and probe wires in order to more deeply debug your test software.
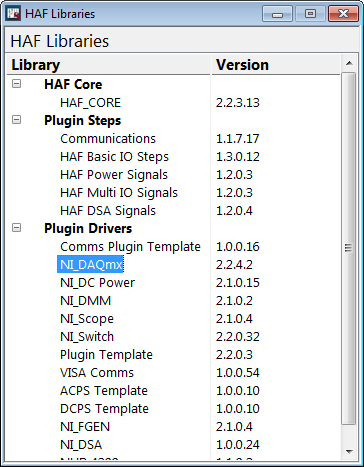
Figure 8: HAF Libraries Viewer
Custom Instrument Interfaces
Finally, we’re excited to announce two new HAF StepTypes to help you interact with drivers at a more advanced level: Get Reference, and Custom Instrument Action.
The  function does exactly what it says. When you use this StepType, you point it to the Alias of the desired instrument, then define the variable where you’d like to store the reference. References can be retrieved as LabVIEW IO Controls (VISA, PXI instruments, etc), Numbers, Strings, and even activeX or .net objects. Once you have the instrument reference, you are free to write any VI you’d like to configure or control the instrument.
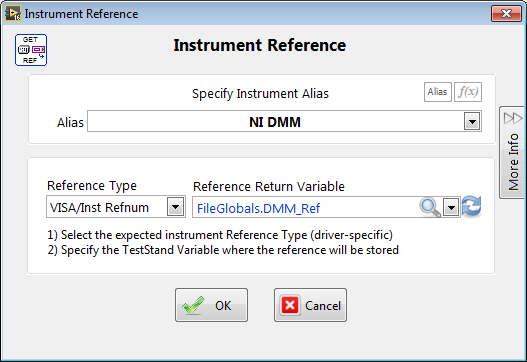
Figure 9: HAF Get Reference StepType
The  allows you to call any HAF Interface Function inside the driver specified by the Instrument Alias. Once a function is selected, the configuration dialog displays all front panel controls and indicators. The developer can then directly set any controls and specify the variables where indicators can be stored. While this technically breaks the full hardware abstraction of the Hardware Access Framework, it allows advanced developers to take advantage of functions that are specific to a particular device that would otherwise be off limits.
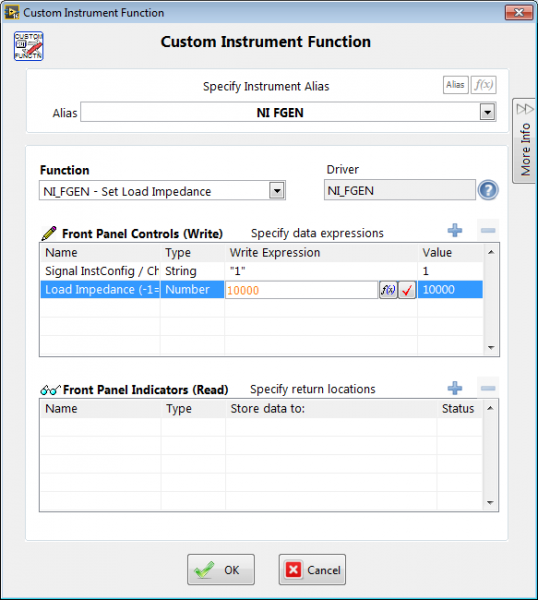
Figure 10: HAF Custom Instrument Action StepType
Related Links
- ggothing's blog
- Log in or register to post comments